Graphics to Create Maps
May 19, 2018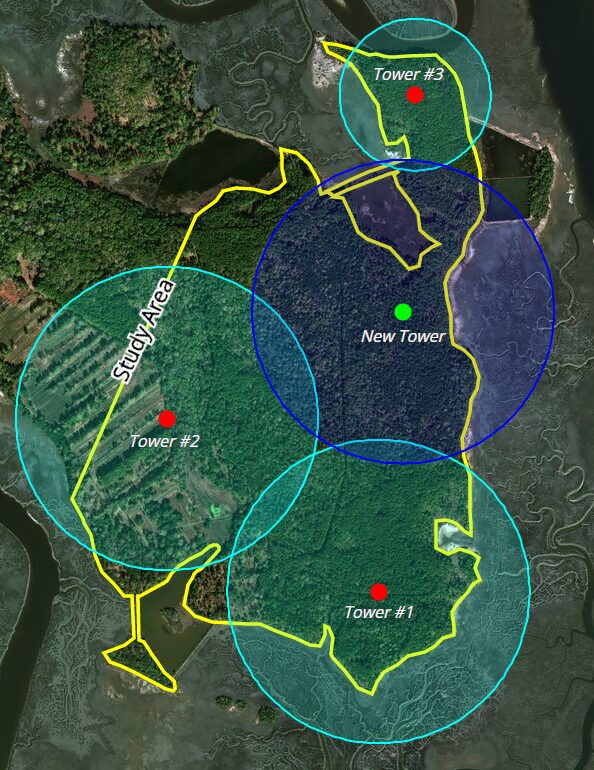
Most people categorize themselves as “visual learners”. When it comes to GIS, the quickest way to convey information is visually. Web-based maps and GIS applications mean that local knowledge is not the only way to learn about a location. Large expanses of land can be broken down by analyzing different sets of data on a single map. From the early days of exploration to managing large environmental sites, to a major company deciding where to open a new headquarters, a well-constructed map makes communicating geography simple.
Latapult has numerous tools to make the map-creation process straightforward and enjoyable. Users can create shapes and text with our graphics tools to customize their maps and highlight areas of interest. Your map and visuals can be exported as a PDF to be used in reports and presentations.
How Do Our Clients Use This Tool?
Engineers can quickly create due diligence maps in Latapult. Project boundaries can be overlaid with wetlands, flood zones, soil types, and elevation data for a quick analysis of an area they are working on. Residential developers can create basic land plans to share with potential buyers and investors. Land planners can display zoning and overlay districts or walkability for residents. Utility companies can create a map of water lines and highlight the location of ticket numbers.