
Utility Mapping Software Built for Reliable Service
Latapult is a next-level utility GIS and mapping software that brings land, infrastructure, and service-area data into one centralized platform, allowing utilities teams to respond faster, work across departments, and keep critical services reliable. Stay up-to-date as demand, weather, and infrastructure data changes. You’ve never experienced GIS software like this.


Make Faster, Smarter Decisions
Why Utilities Teams Rely on Latapult

Stop Hunting for Information
Bring decades of infrastructure records, maps, and PDFs into one centralized utility mapping software platform.

Get the Right Data in the Right Hands
Give office staff and field crews fast access to the GIS mapping for the utilities they need to respond and repair.

Respond Faster to Issues
See what’s underground, what’s connected, and what’s at risk before crews roll out.

Supplement Institutional Knowledge
Turn paper maps and memory into a shared GIS mapping system your whole team can trust.

Plan Ahead with Confidence
Use accurate land and infrastructure data to guide maintenance and capital improvement planning.

Create Professional Maps and Reports
Generate clean, clear visuals for planning, reporting, and stakeholder communication.
One Place for Every Pipe, Parcel, and Project
Latapult centralizes your utilities infrastructure data, service areas, and land information into one GIS platform. It connects in-office teams, field crews, and leadership around a shared view of what exists today and what needs attention tomorrow.
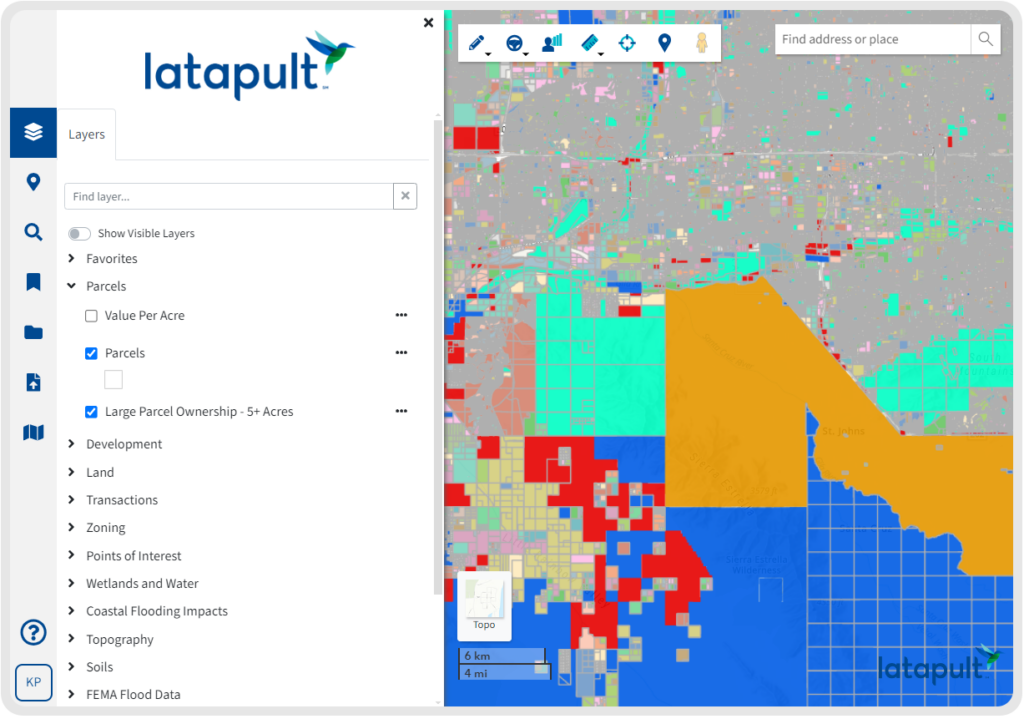
With dynamic maps and searchable attribute-level data, your team can:
- View parcels, infrastructure, flood zones, soils, and environmental
constraints together
- Share accurate information between departments
- Track service areas and projects in one place
- Reduce delays caused by scattered files and disconnected systems

We work with utility managers and operators nationwide. Put your trust in our experienced hands.
-
300+
Businesses nationwide
Supported in uncovering insights that transform projects.
-
50x
Faster search
To quickly and strategically respond to service and work order questions.
-
$1K+
In savings a month per user
On resources, labor, and more.
-
$1M+
In GIS data
Powering environmental, demographic, geospatial, and topographic insights.
GIS Land Data Layers Built for Utilities Teams
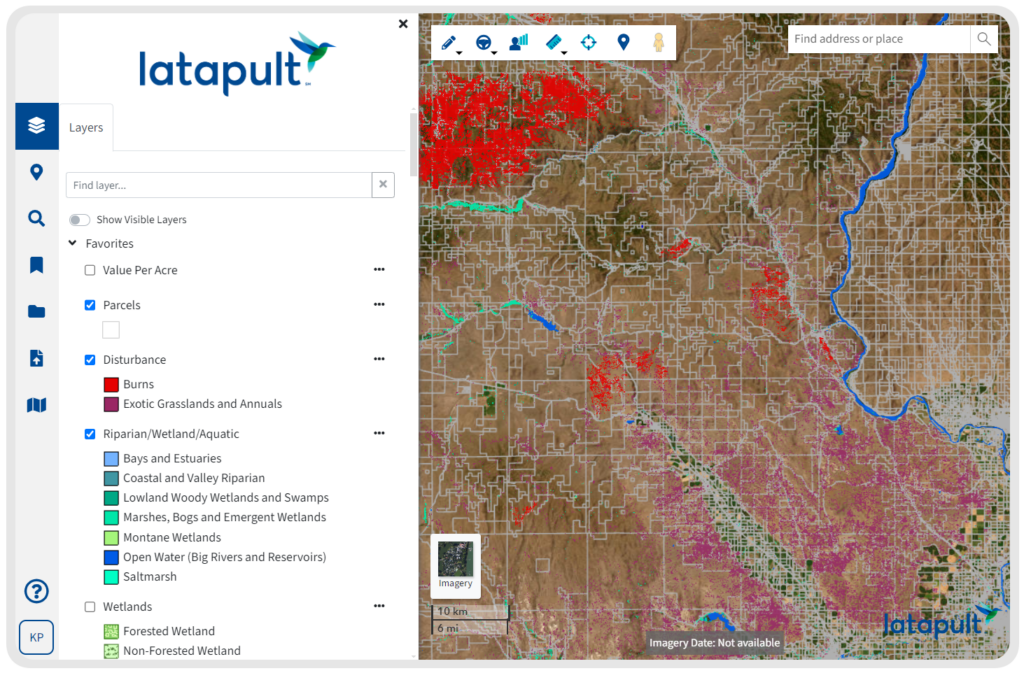
Latapult brings together the land and infrastructure data utilities rely on, including:
- Census and demographic data
- Parcel and land attributes
- Transportation and access information
Utilities teams can also import their own internal datasets to build a complete view of service areas, assets, and project activity. This gives your team a credible, up-to-date foundation for utility planning and reporting.
Collaborate Around a Single Map
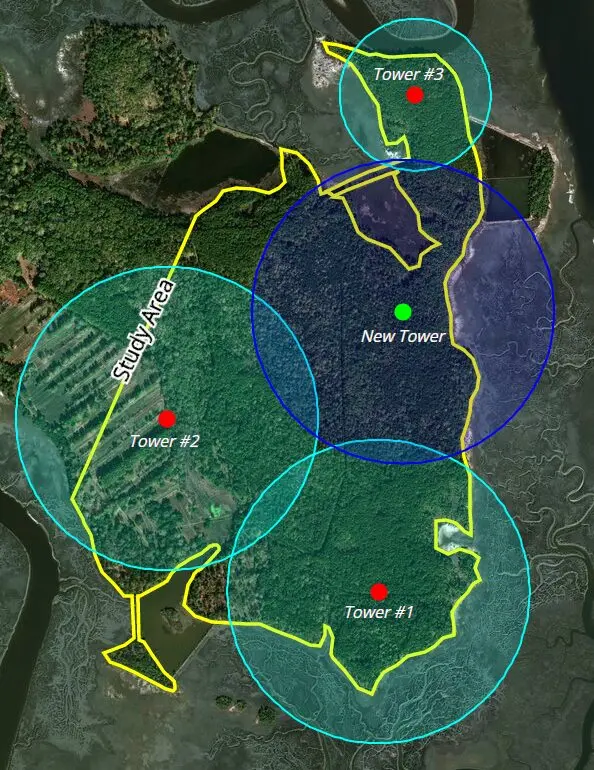
Latapult’s GIS for water utilities makes it easy for teams across departments to work from the same information and move projects forward with clarity.
- Use dynamic mapping tools to visualize infrastructure and service areas
- Share maps and reports across teams and stakeholders
- Support capital improvement planning with accurate, visual data
From daily operations to long-term infrastructure investment, Latapult helps utilities move from scattered information to coordinated action.

Custom GIS Solutions for Utility Operations
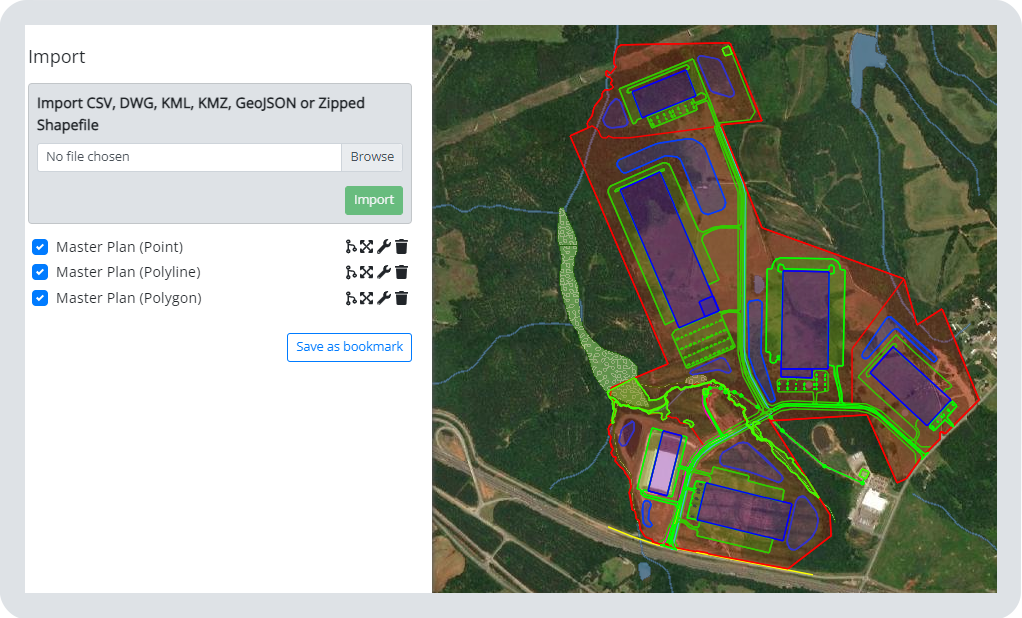
Every utility operates within its own infrastructure systems, regulatory requirements, and asset management processes. Latapult can be configured to reflect the data, workflows, and reporting structures that drive your operations.
- Import and manage proprietary infrastructure datasets alongside
planning, zoning, and other local GIS layers
- Configure searchable forms and asset fields aligned to internal tracking
and compliance workflows
- Attach photos, permits, and supporting documentation directly to
mapped features
- Enable field teams to access and update infrastructure data from mobile
devices


Frequently Asked Questions
-
How is GIS used in utility mapping?
GIS is a geographic information system that can be used to visualize, manage, and analyze land and infrastructure data in a single digital map. For utilities teams, GIS utility mapping makes underground and above-ground assets—such as water, sewer, and stormwater infrastructure, pipes, service areas, parcels, and environmental constraints—visible and searchable.
This gives teams a centralized view of their infrastructure so they can support daily operations and maintenance, assess risk, improve storm preparedness, and plan for long-term resilience with accurate, up-to-date data.
-
How do water utility teams use GIS tools?
Water utility networks use GIS mapping data to understand what infrastructure exists, where it is located, and how different systems connect. GIS mapping allows utilities teams to view service areas, pipes, flood zones, parcels, and environmental conditions together. This supports faster response to service issues, clearer communication between office staff and field crews, and more informed decisions for maintenance and capital improvement planning.
-
What tasks can water utility teams accomplish with GIS?
GIS has many practical applications in water utility networks, including:
- Visualizing water infrastructure and service areas
- Managing asset and project information in one centralized map
- Supporting maintenance planning and capital improvement projects
- Sharing accurate maps and reports across departments
- Evaluating land and environmental conditions that affect infrastructure
- Improving coordination between office teams and field crews
These applications help utilities replace disconnected files and paper maps with a shared digital system of record.
-
What are the benefits of GIS for utility networks?
GIS helps utility networks work more efficiently by centralizing infrastructure data, improving visibility, and supporting better planning.
Key benefits include:
- Faster access to accurate infrastructure information
- Improved collaboration across departments
- More reliable maintenance and capital planning
- Reduced delays caused by scattered records
- Clearer reporting and communication with stakeholders
By using GIS mapping for water utilities, organizations can make better decisions about service delivery, infrastructure investment, and long-term planning.
-
How can Latapult help utilities teams?
Latapult helps utilities teams centralize infrastructure, land, and service-area data into one shared GIS mapping platform. It replaces scattered PDFs, paper maps, and disconnected systems with a single map that office staff, field crews, and leadership can all use.
With Latapult, utilities teams can:
- See infrastructure, parcels, flood zones, and environmental data in one place
- Share accurate maps and reports across departments
- Support faster response to service issues
- Plan maintenance and capital improvement projects with greater confidence
- Work from the same up-to-date information across daily operations and long-term planning
This gives utilities organizations a clearer, more reliable foundation for managing infrastructure and delivering service.
-
What makes Latapult different from other GIS software?
Most GIS platforms are built for specialists and can be difficult for teams with no previous experience to use.
Latapult centralizes infrastructure and land data into one shared, web-based mapping platform that analysts, field crews, managers, and planners can all use. Teams can visualize data, collaborate on projects, integrate with work order systems, and share accurate maps without relying on complex GIS programming.
Instead of becoming another isolated tool, Latapult becomes a shared system of record that replaces scattered maps, PDFs, and disconnected systems with one source of truth your team can actually use.