Overcoming the Challenges of Flood Zone Mapping
June 18, 2024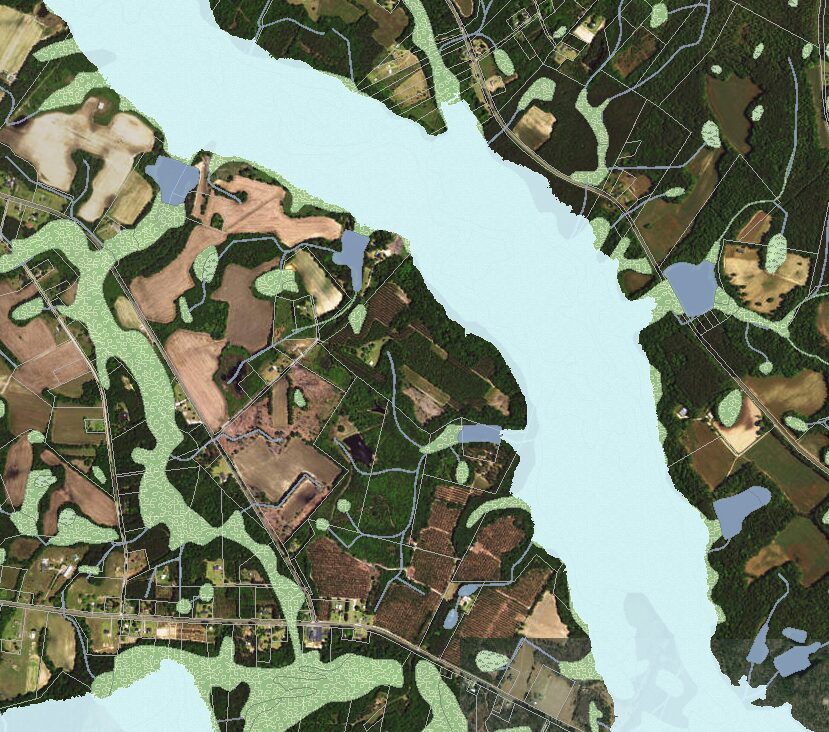
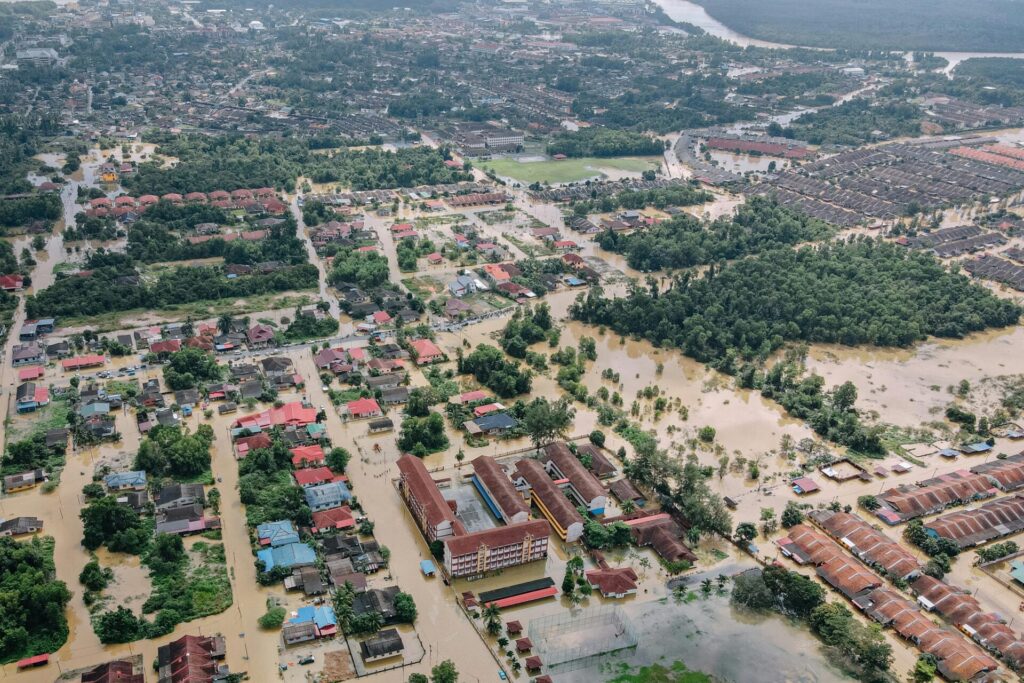
The Southeastern United States is known, in part, for its pristine coastal communities and stunning marshlands. But these same qualities that make the Southeast an attractive place to live and visit also make it a challenging place for developers to build. Since much of this land is in flood zones, land acquirers and developers need an accurate, accessible way to measure risk vs. reward when determining where – and what – to build.
Common Sources for Flood Zone Maps
Usually, all people need to know is “is this land in a flood zone?” or “is this parcel wetland or upland?” Yet, those simple inquiries about flood risk can be a challenge to answer. The Federal Emergency Management Agency’s (FEMA) flood mapping system is the go-to source for flood zone information. However, FEMA’s portal only allows people to search by specific address, and the resulting map does not show property lines or how much of a property is in a flood zone. If a property is close to a boundary, it can be unclear whether that parcel is actually in or out of the flood zone.
The U.S. Fish and Wildlife Service (USFWS) provides a similar online portal for National Wetlands Inventory (NWI) data, presenting the same challenges as FEMA’s data. Plus, having separate views of flood zones and wetlands makes it difficult to understand what is actually happening on the property.
A third source – county GIS sites – is inconsistent at best. Though county GIS maps do typically show property lines, they may or may not have flood zone maps included. And even for counties that do offer this data, it’s often outdated and not a reliable source for critical decisions.
All-in-all, simply accessing and mapping flood zones requires multiple sources, with poor user interfaces and often indecipherable boundary lines.
Determining Risk
The higher the portion of a property that is in a flood zone or wetland, the higher the cost associated with development, so it’s critical that land owners and developers have accurate information on how much of a parcel is in a flood zone or wetland, and which risk zone(s) they are entering. The riskiest flood zones, those with a 1 percent annual chance of flood, include: Zone A, Zone AO, Zone AH, Zones A1-A30, Zone AE, Zone A99, Zone AR, Zone AR/AE, Zone AR/AO, Zone AR/A1-A30, Zone AR/A, Zone V, Zone VE, and Zones V1-V30. Each of these equates to higher insurance costs, with V – indicating the risk of storm-induced wave velocity – resulting in the highest rates.
Developers have to carefully measure risk vs. reward when it comes to flood zones and wetlands. Will those stunning ocean views result in sales prices that will support the increased cost of development? Will property owners be able to stomach the insurance premiums? Does the nearby traffic volume or school district make the land highly desirable, despite increased development costs? Knowing these answers can help developers and land owners make the best decisions.
On-Demand GIS Eliminates the Burden of Flood Zone/Wetland Mapping
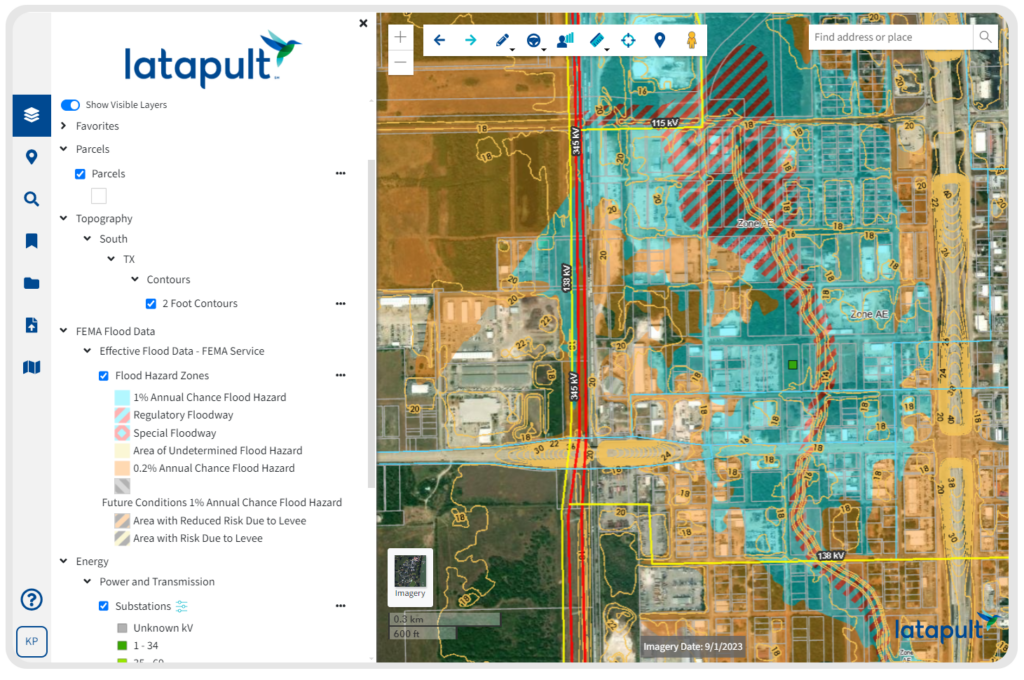
On-demand GIS systems, like Latapult, can layer real-time data from the FEMA National Flood Hazard Layer with NWI information and property line maps for a comprehensive view of the lay of the land. With the click of a button, users can evaluate flood zones and wetlands in relation to property boundaries. Add in layers for railways and interstates, for example, and industrial developers will have a solid map via which to measure the opportunity of a parcel. Residential developers, on the other hand, can check school districts, current zoning, topography, and nearby stores and entertainment options. In both cases, developers can get a clear picture of their area in relation to flood zones, in one system vs. having to visit multiple websites, to make data-driven decisions and intelligent investments.
At Latapult, we use a live web service provided by FEMA that always includes the most up-to-date information and comprehensive flood zone maps. Our Large Parcel Insights layer also breaks down the upland vs. wetland acreage on a parcel (with the ability to analyze upland acreage further by slope percent). Latapult makes it easy to determine the wetland/upland ratio of a property with just a couple of clicks.
Want to see how it works? Sign up for a free trial today.